
Archive for March, 2017
Isabel Gauthier

Isabel Gauthier is outgoing editor of JEP: General and incoming editor at JEP: Human Perception and Performance. We are very happy that she has agreed to follow our invitation to Basel to give a PhD workshop (“Meet the Editor”) on the publishing process within psychology on Thursday, 23.3.
Beyond being a very successful editor, Isabel also does highly interesting research. On Thursday, 23.3. she will be giving a talk on her current research from 17:00-18:00. The talk will take place at Missionsstrasse 64a in room 00.008. Titel and abstract are listed below.
Title: Individual differences in object recognition
Speaker: Isabel Gauthier (Vanderbilt University)
Abstract: There is substantial evidence for individual differences in personality and cognitive abilities, but we lack clear intuitions about individual differences in visual abilities. Previous work on object recognition ability has typically compared performance with only two categories, each measured with only one task. This approach leads to results that are difficult to interpret and is thus insufficient for demonstration of domain-general effects. Furthermore, most previous work has used familiar object categories, for which experience may vary between participants and categories thereby reducing correlations that would stem from a common factor. Drawing from the literature on individual differences in other areas, the work I will present adopted a latent variable approach to test for the first time whether there is a domain-general Object Recognition Ability, o. Specifically, we assessed whether shared variance between latent factors representing performance for each of five novel object categories could be accounted for by a single higher-order factor. Our results showed that on average 89% of the shared variance between performance with novel object categories could be accounted for by a higher-order factor, providing strong evidence for o. Moreover, o also accounted for a moderate proportion of variance in tests of familiar object recognition. Together, these results provide the first demonstration of a reliable, domain-general Object Recognition Ability, and suggest a rich framework for future work in this area.
Susanne Scheibe

We have Susanne Scheibe, University of Groningen, visiting this week and giving a talk in the Social, Economic, and Decision Psychology colloquium (title and abstract follow).
Getting better with age? An emotion perspective on the aging worker
Decades of research on emotional aging have demonstrated that older adults enjoy relatively high well-being and experience advantages in several emotional competencies (such as emotion understanding and regulation) compared to young adults. Yet, despite the fact that working-age adults spend much of their time working and that pressures rise to work longer, little is known about the implications of age-related differences in emotional functioning for work outcomes. I will summarize theory and findings on emotional development across adulthood which show that, in contrast to typical decline seen in cognitive and physical domains of functioning, age-related changes in the emotional domain are mostly positive. Building on this work, I will present a series of studies with workers in the service and healthcare sectors, including studies using the experience-sampling methodology, that seek to understand the ramifications of emotional development for an aging workforce. These studies suggest that emotional changes with age can confer benefits for occupational health and well-being of older workers, especially in contexts that are emotionally charged.
Julia Rohrer

We have Julia Rohrer visiting us this week and giving a talk in our colloquium (title and abstract below). Julia is a fellow of the International Max Planck Research School on the Life Course, affiliated with the Free University Berlin and the German Institute for Economic Research. Julia is also a contributor to The 100% CI blog.
Shifting Priorities: The impact of life domains on life satisfaction across the life course
A vast body of research has investigated the relationships between happiness and a wide range of potential predictors. In contrast, surprisingly few studies have addressed how these relationships might change across the life course. Yet various theoretical perspectives suggest that the importance of different life domains for well-being depends on age. In my talk, I will sketch a framework for the investigation of the moderating impact of age and present results based on multiple panel studies. Overall, results show that the weights assigned to different life domains change across the life course. The observed pattern mirrors developmental tasks and is further corroborated by respondents’ text reports of what they personally consider important.
Paul Slovic

Paul Slovic is a towering figure in the field of decision sciences, having made important contributions to understanding how people deal with risk in multiple domains, from decisions between gambles to technological risks such as nuclear power. More recently, Slovic has focused on understanding the psychological principles underlying empathy in decisions to donate to charity and other societal issues dealing with the processing of risk and statistical information.
A profile of Slovic’s life and work has recently come out in PNAS that could be interesting for those less familiar with his work…
hurrah for funding transparency at SNSF
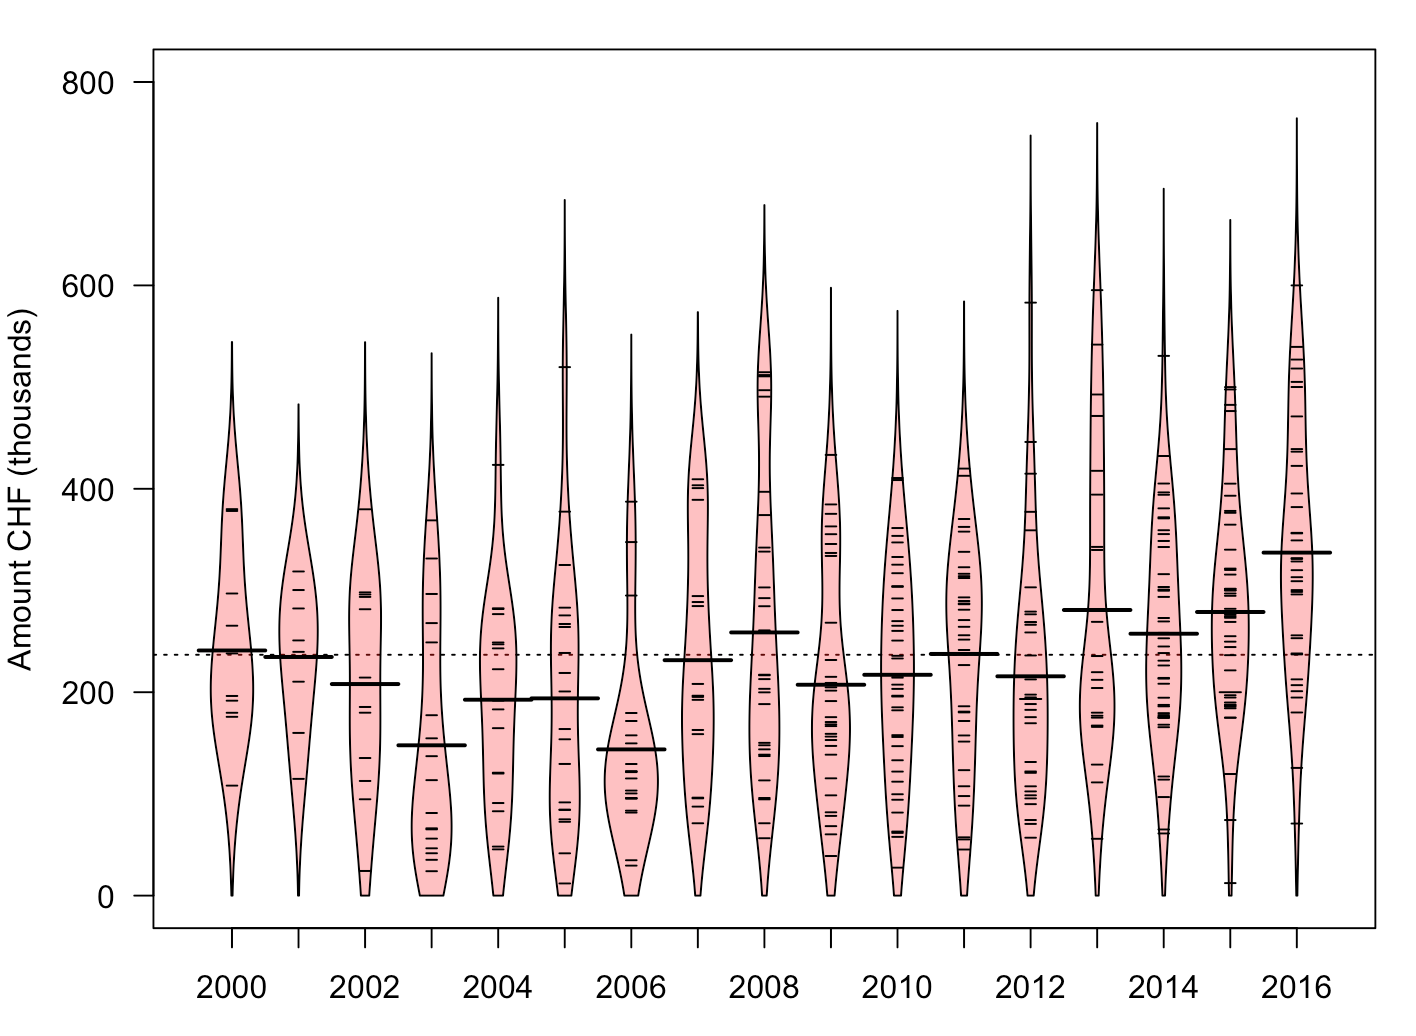
I’m in the process of writing a grant application (aren’t we all?) and wanted to know what the typical funding amounts are for psychology grants awarded by the Swiss National Science Foundation (SNSF). Fortunately, I didn’t have to guesstimate but could simply go online to get the appropriate csv file and find out.
The figure above shows beanplots for all psychology grants awarded since 2000 (but perhaps Nathaniel could make a more informative and aesthetically pleasing figure using a pirateplot?!).
Go SNSF!
Dr. Nathaniel Phillips featured in the APS Observer’s March Methodology Madness issue
Link: YaRrr! The Pirate’s Guide to R in March Methodology Madness issue of the APS Observer
This month’s issue of the APS Observer is a special issue on research methodology called March Methodology Madness. As part of the issue, Dr. Nathaniel Phillips, a researcher at Basel’s Economic Psychology group, was featured for his work on his R package yarrr and book YaRrr! The Pirate’s Guide to R. In the article, Nathaniel explains how he used R to solve a persistent data visualisation problem: despite the fact that statisticians have been complaining about bad data visualisations for years (see Cleveland, 1983), researchers are still stubbornly using notoriously deceptive barplots to represent their data. The problem with barplots is that they reduce data to a single descriptive statistic, usually a mean, with an additional interval usually representing a 95% confidence interval (whatever those mean: see Hoekstra et al., 2014 and Morey et al., 2016). While barplots tell simple stories, they do so at the cost of hiding potential important distributional information like influential outliers and skewed distributions which, in some cases, can completely change their story.
Sadly, despite that we’ve been told that barplots are terrible for years, and even a — I’m not joking — successful Kickstarter campaign to Bar barplots, barplots haven’t gone anywhere. A look at any recent psychology publication will show that we still can’t help but to reduce our data to a simple set of bars.
To try and banish barplots for good, Nathaniel created the pirateplot() function. A pirateplot is an “RDI” plot inspired by the beanplot (Kampstra, 2008) and violin plot (Hintze & Nelson, 1998) that which shows Raw data (individual points), Descriptive statistics (means, medians, and/or quantiles), and Inferential statistics (densities and frequentist or Bayesian confidence intervals) in one elegant and colorful plot. Pirateplots are not only much more informative than standard barplots, they are also much easier to create and customise.
For more details on why pirateplots are so fun and easy to create, read on for the full article at http://www.psychologicalscience.org/observer/yarrr-the-pirates-guide-to-r
If you are an R user (and you should be!), you can also start creating your own pirateplots in seconds in R with the following code:
install.packages("yarrr")   # Install the yarrr package

library("yarrr")            # Load the yarrr package

yarrr.guide()               # Open the package guide

4 elements of a pirateplot: Points representing raw data, Lines representing a descriptive summary statistic, beans representing smoothed distributions, and bands representing inference.
References
Cleveland, W. S. (1984). Graphs in scientific publications. The American Statistician, 38(4), 261-269.
Hintze, J. L., & Nelson, R. D. (1998). Violin plots: a box plot-density trace synergism. The American Statistician, 52(2), 181-184.
Hoekstra, R., Morey, R. D., Rouder, J. N., & Wagenmakers, E. J. (2014). Robust misinterpretation of confidence intervals. Psychonomic bulletin & review, 21(5), 1157-1164.
Kampstra, P. (2008). Beanplot: A boxplot alternative for visual comparison of distributions. Journal of statistical software, 28(1), 1-9.
Morey, R. D., Hoekstra, R., Rouder, J. N., Lee, M. D., & Wagenmakers, E. J. (2016). The fallacy of placing confidence in confidence intervals. Psychonomic bulletin & review, 23(1), 103-123.